
Business intelligence dashboard software is a data visualization tool that shows the current status of metrics and key performance indicators for a company or an enterprise. Dashboards merge and arrange metrics, numbers and performance scorecards on a single screen. Business intelligence dashboards may be crafted for specific roles or it may demonstrate metrics targeted for a single point of view or department. The most prominent feature of the business intelligence dashboard is the customization interface and the capability to pull real-time data from multiple sources. A business dashboard can also track progress towards a goal. So if you are looking for business intelligence dashboard software or data visualization software then take a look at the definition and benefits of business intelligence dashboard.
What is Business Intelligence Dashboard?
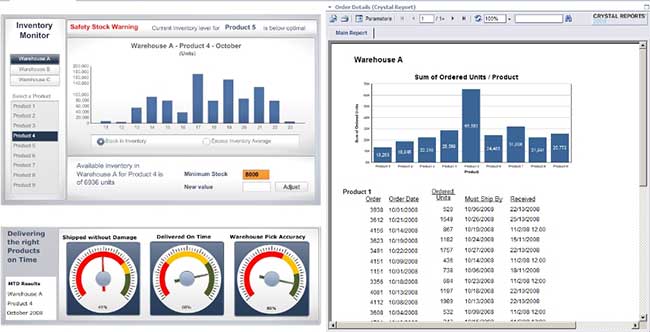
Business intelligence dashboard is specially crafted to enable users to receive a quick visualization of their preferred BI specific operations to eliminate requirements for manually executed queries and processes. This dashboard is a BI software interface that offers reconfigured or customer-defined metrics, insights, statistics, and visualization into current data. Each component of BI software solutions works like a standard application dashboard that collects two or more key performance indicators and statistics into a visual interface. The interface and appearance of BI dashboard can be customized for different devices like mobile, desktops and web/cloud users. When any user login into the BI software, BI dashboard is the first element that appears on the user screen. The amount and the type of data displayed to the user vary according to the BI software capabilities and customization. It enables the end user of BI software to view quick results into the current performance state of business or data analytics.
Benefits of Using a Business Intelligence Dashboard
Big Time Savings
Business intelligence software measures the amount of time that the staff spent in crafting reports on Excel or other spreadsheet programs. The reports that are created more than once should go in your dashboards, and these reports can be processed to be updated every hour.
Increased Productivity
Companies can easily measure the performance numerically with the help of business intelligence dashboards. With these amazing dashboards, customer service manager can easily see the metrics such as the average speed of answering phone calls, and return rate.
Increased Profits
Business Dashboards also displays the areas of business that are performing poorly. So you can quickly focus your time to increase your productivity and results. Companies can immediately know what is working right in their business and what’s not to increase their profits as well as sales. Organizations can find the overall view of your business by implementing dashboards.
Customization To Different Management Levels
Business dashboards can be customized according to the individual customers. With business intelligence dashboards, the executive can see a high-level graph of department productivity and managers and department level can easily see their specific details for the particular month. It also enables each person to see the standard of detail that they need to get their job done and meet their goals.
Total Visibility into Your Business
With business intelligence dashboard, companies can easily know what going on in your business all the times. These dashboards show you exactly how your last email blast to your customers went, the number of people who opened your email and many sales that it brings.
Trending Visibility
Business intelligence dashboards generate the summary information that is displayed to the user so that they can see the trends of data over a period. This enables managers and employees to make decisions and react to the issues before become problems. For an instance if a call center manager is observing that the incoming calls are raising each week or month then they begin to explore the issue the reasons that made the customers angry.
Learn More about Business Intelligence Dashboard,


Mark Reynolds
Apr 07. 2016
I’ve been following your blog for a while now and all I can say is brilliant. Articles are direct to the point, short and simple. Easy to understand.
Sherry
Apr 15. 2016
Thanks for this article